Technical Indicators & Analytical Tools for Futures Trading
Futures trading has become increasingly popular among traders seeking to capitalize on market movements. Success in this high-stakes arena often hinges on the ability to predict market trends and price movements accurately. One way to enhance your predictive accuracy is through the use of technical indicators and analytical tools. In this blog, we’ll explore some of the most effective tools and indicators that can help traders on Unitic Exchange make informed decisions in futures trading.
1. Moving Averages (MA)
Moving Averages (MA) are one of the most commonly used technical indicators in futures trading. They smooth out price data to create a single flowing line that represents the average price over a specific period. There are different types of moving averages:
- Simple Moving Average (SMA): This is the straightforward average of prices over a set period.
- Exponential Moving Average (EMA): Places more weight on recent prices, making it more responsive to new information.
How to Use: Moving averages can help identify trends and potential reversal points. For instance, a crossover between the short-term EMA and long-term EMA might signal a buy or sell opportunity.
2. Relative Strength Index (RSI)
The Relative Strength Index (RSI) is a momentum oscillator that measures the speed and change of price movements. It ranges from 0 to 100 and is typically used to identify overbought or oversold conditions in the market.
How to Use: An RSI above 70 typically indicates that a security is overbought, while an RSI below 30 suggests it may be oversold. Traders on Unitic Exchange can use RSI to time their entry and exit points more effectively.
3. Bollinger Bands
Bollinger Bands consist of a middle band (usually a 20-day SMA) and two outer bands set two standard deviations away from the middle band. These bands expand and contract based on market volatility.
How to Use: When the market is quiet, the bands contract; when it's volatile, they widen. Traders can use Bollinger Bands to identify potential breakout points and gauge whether a market is overbought or oversold.
4. Moving Average Convergence Divergence (MACD)
The MACD is a trend-following momentum indicator that shows the relationship between two moving averages of a security’s price. It’s composed of the MACD line, the signal line, and a histogram.
How to Use: When the MACD line crosses above the signal line, it may indicate a bullish signal, and when it crosses below, it might suggest a bearish signal. The histogram helps to visualize the difference between the MACD and the signal line, providing additional context for trades.
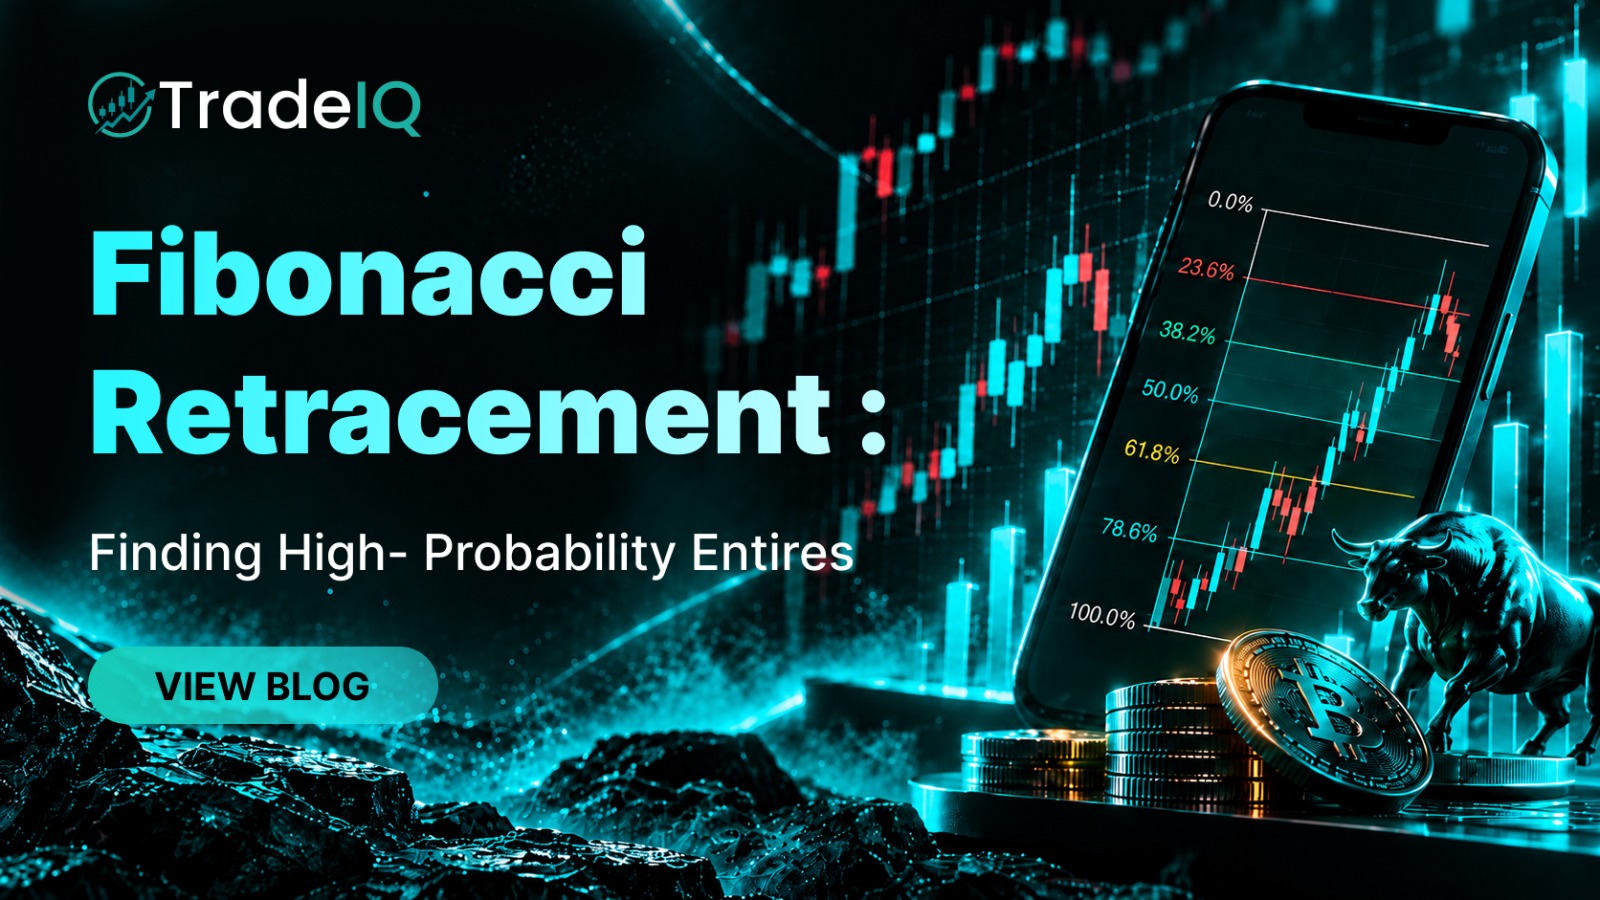
5. Fibonacci Retracement
Fibonacci Retracement is a popular tool used to identify potential support and resistance levels. It’s based on the idea that markets will retrace a predictable portion of a move, after which they will continue to move in the original direction.
How to Use: Traders on Unitic Exchange can use Fibonacci retracement levels to determine where to place orders for entry, taking profits, or setting stop-losses.
6. Volume Profile
Volume Profile shows the amount of trading activity at different price levels, which helps traders identify significant support and resistance zones.
How to Use: High-volume nodes indicate strong support or resistance levels, while low-volume nodes suggest areas of potential price movement. This tool can help Unitic Exchange traders fine-tune their strategies by understanding where most of the trading volume is concentrated.
7. Candlestick Patterns
Candlestick Patterns provide visual insights into market sentiment. Common patterns include the Doji, Hammer, and Engulfing patterns, each offering potential indications of market reversals or continuations.
How to Use: By analyzing these patterns, traders can make predictions about future price movements. For instance, a Hammer pattern at the bottom of a downtrend might indicate a potential reversal.
8. Ichimoku Cloud
The Ichimoku Cloud is a comprehensive indicator that shows support and resistance levels, momentum, and trend direction all in one view.
How to Use: It consists of several lines and a "cloud," which provides a snapshot of market sentiment. Traders can use this to assess the overall trend and potential reversal points.
9. Pivot Points
Pivot Points are used to identify potential support and resistance levels. They are calculated using the high, low, and close prices of the previous trading day.
How to Use: Pivot points are especially useful in intraday trading. If the price is above the pivot point, it is typically seen as bullish; if it’s below, it may be bearish.
Technical indicators and analytical tools are essential for anyone serious about futures trading. They provide the data-driven insights necessary to make informed decisions and increase the likelihood of success in the market. Unitic Exchange offers a robust trading platform where you can utilize these tools to enhance your trading strategies. Whether you’re a novice trader or a seasoned professional, mastering these indicators will give you an edge in the competitive world of futures trading.





Your Crypto Gateway


Unitic Exchange
All rights reserved 2026